
Sales Analysis by item type
Project description
This project represents a typical analysis of sales data using SQL and Power Bi.
Sample Dataset used : https://eforexcel.com/wp/downloads-18-sample-csv-files-data-sets-for-testing-sales (5M rows)


KPIs
- Most recent and oldest 5 item orders.
- Most sold and most profitable item types.
- Total profit per location for each and all individual item types.
- Locations with the highest number of sales for each item type.
- Annual revenue for each item type.
- Most profitable month for each item type.
- Sales per day for each item type.
- Item type with the most sales for each year.
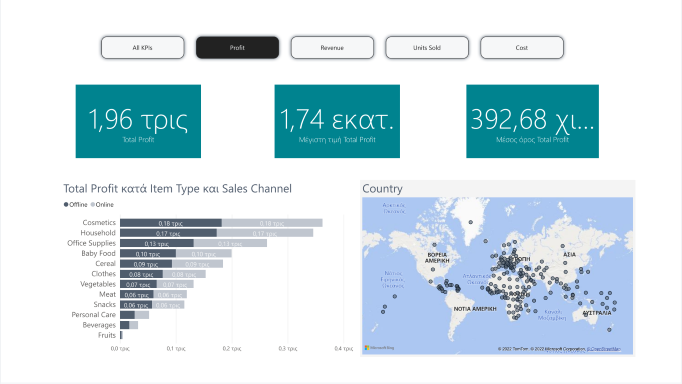
Dashboard
Created a fully interactive dashboard displaying, based on the filters applied :- The most profitable item type and distribution channel.
- The total revenue generated for the most profitable item type.
- The total units sold for each item type, broken further down by distribution channel.
- The most profitable months for an item type.
- The total profit for each item type, broken further down by distribution channel.